This notebook presents how to change the style or appearance of matplotlib plots. In addition to the rcParams dictionary, the matplotlib.style module provides facilities for style sheets utilization with matplotlib. Look at this page of the matplotlib documentation to know how it works in details.
Hereafter, I present how to load a style and I give you a style sheet I use for my plots.
How it works
import matplotlib
import matplotlib.style as mpl_style
The mpl_style.available attribute outputs the available styles. Since matplotlib version 2 and higher, you can load for example seaborn styles directly in matplotlib.
mpl_style.available
['seaborn-dark',         'seaborn-darkgrid',  'seaborn-ticks',
 'fivethirtyeight',      'seaborn-whitegrid', 'classic',
 '_classic_test',        'fast',              'seaborn-talk',
 'seaborn-dark-palette', 'seaborn-bright',    'seaborn-pastel',
 'grayscale',            'seaborn-notebook',  'ggplot',
 'seaborn-colorblind',   'seaborn-muted',     'seaborn',
 'Solarize_Light2',      'seaborn-paper',     'bmh',
 'tableau-colorblind10', 'seaborn-white',     'dark_background',
 'seaborn-poster',       'seaborn-deep']
If you want to use one specific style, you simply have to load it, for example for the seaborn-dark style, using:
mpl_style.use("seaborn-dark")
Or you can also combine several styles:
mpl_style.use("seaborn-dark")
mpl_style.use(["seaborn-ticks", "seaborn-dark"])
Custom styles
There are several ways to change globally or temporary the plot default parameters.
Use rcParams dictionary
You can directly modify parameters of the rcParams dictionary, for example at the beginning of a notebook, in order to apply a style to all the plots. For example, the following changes the size of the plots, the font size and ask for a grid to be drawn:
plt.rcParams["figure.figsize"] = (10, 6)
plt.rcParams["font.size"] = 20
plt.rcParams["axes.grid"] = True
Use matplotlibrc
You can download from here the matplotlibrc file. This file contains all the style options of the plots. Modify the file as you wish in order to change the default parameters. Look at this page in order to know where you have to save the file.
If you want the parameters to be limited to a specific location, copy the matplotlibrc file in your working directory. Then, only the plots you will create in this directory will be affected by these parameters.
Create your own style sheet
A matplotlib style sheet has the same format and syntax as the matplotlibrc file. You simply have to put in this file the specific parameters you need. Suppose that at the beginning of all your jupyter notebook, you always modify the same keys of the rcParams dictionary. You can consider to write these parameters in a style sheet and load that parameters at the beginning of the notebook.
In order to know where you have to save your style sheet, you can run the following command.
matplotlib.get_configdir()
'/Users/gvallver/.matplotlib'
The style sheets have to be in a sub-directory called stylelib of the above location. You have to save the style sheets with names such as my_style.mplstyle.
Hereafter is the style sheet I wrote to produce figures for scientific publications. This is not a perfect style sheet but a not too bad working example. Just save it put your own touch.
my style sheet
#### MATPLOTLIBRC FORMAT

## matplotlib configuration for plots for publications.

#### FIGURE
figure.figsize    : 11.67, 8.27
savefig.dpi       : 300
savefig.bbox      : tight

#### FONT
font.size         : 24
font.family       : serif

#### LaTeX
mathtext.default  : regular

#### AXES
axes.linewidth  : 2
axes.grid       : True

#### TICKS
xtick.direction     : in
xtick.top           : True
xtick.major.width   : 2
xtick.major.size    : 10
xtick.minor.visible : True
xtick.minor.width   : 2
xtick.minor.size    : 5

ytick.direction     : in
ytick.right         : True
ytick.major.width   : 2
ytick.major.size    : 10
ytick.minor.visible : True
ytick.minor.width   : 2
ytick.minor.size    : 5
Example
%matplotlib inline
import matplotlib.pyplot as plt
import numpy as np
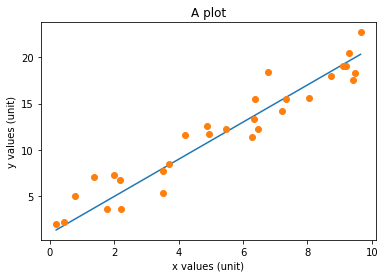
Plot a simple linear function as if it was a model of some experimental data.
x = np.random.uniform(0, 10, 30)
x.sort()
yt = 2 * x + 1
y = yt + np.random.normal(loc=0, scale=2, size=y.size)

plt.plot(x, yt, label="model")
plt.plot(x, y, "o")
plt.xlabel("x values (unit)")
plt.ylabel("y values (unit)")
plt.title("A plot")
Text(0.5, 1.0, 'A plot')
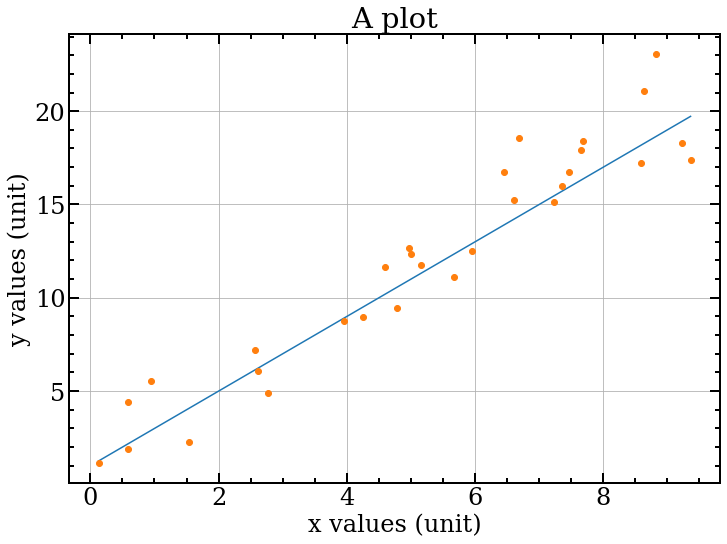
Now, supposed you have saved you style sheet with as publi.mplstyle in the right directory. You can load the style and draw the plot:
with plt.style.context(('publi')):
    plt.plot(x, yt, label="model")
    plt.plot(x, y, "o")
    plt.xlabel("x values (unit)")
    plt.ylabel("y values (unit)")
    plt.title("A plot")