Here is an example of a treemap plot using python, matplotlib and the squarify module.
The data comes from the open data of the Communauté d’Agglomération Pau-Pyrénées.
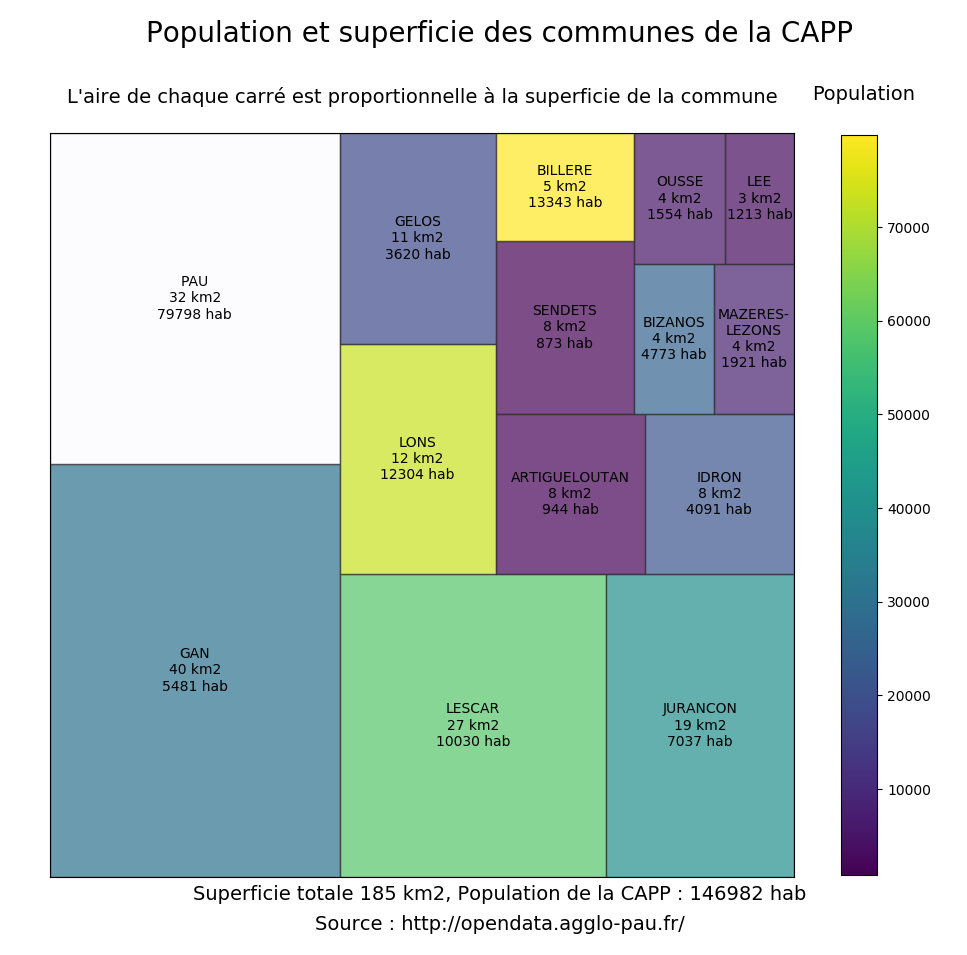
The idea is the following :
- The area of each square is the surface area of the towns
- The color scale is over the population in 2011
Source code :
Output
Because of the large population of Pau against other towns in the communauté des communes, I draw a white square background and I did not include it in the color scale. Nevertheless, the area of the rectangle is consistent with the area of Pau.
The plot was produced using the following packages and python versions:
python     :  3.7.6
pandas     :  1.0.1
matplotlib :  3.1.3
squarify   :  0.4.3